Welcome
Hello!
I'm Cierra.
I'm an artist, technical trainer, and strategic communicator.
I hold a degree in Digital Media and Web Technologies, but as of late I have been creating data visualizations for my studies as a Data Science student.
My heart and passion live at the intersection of creativity and technology.
I hope you enjoy this quick snapshot of some of my favorite projects.
Training Aid Product
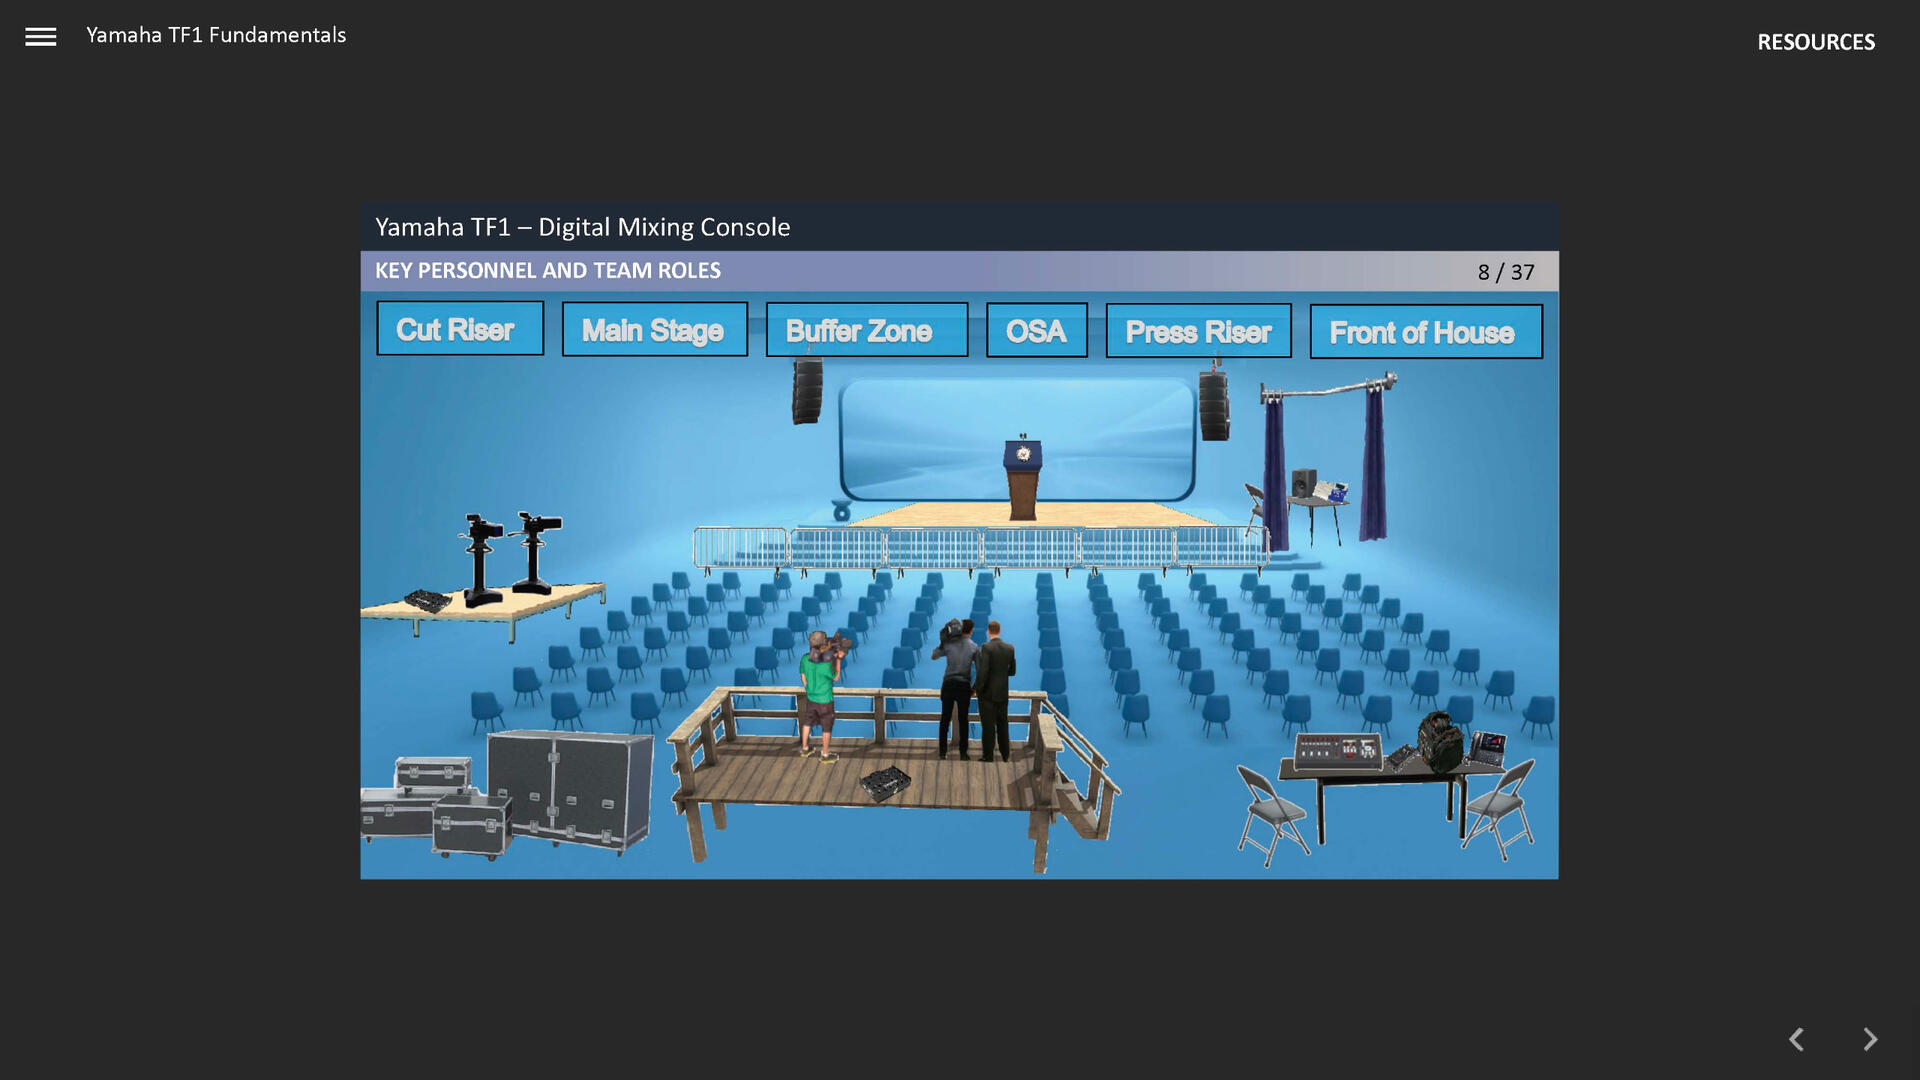
This is one of my favorite projects because it was built out of necessity to replace an outdated block chart. I used this in an e-learning module for a course I used to teach to adult learners and then it was later added to training documentation for new members to the organization. Because the product was created on a work computer with limited resources and no access to the Adobe suite, I utilized PowerPoint, MS Paint, and a 3D stock photos website to put the image elements together.
Tableau Viz
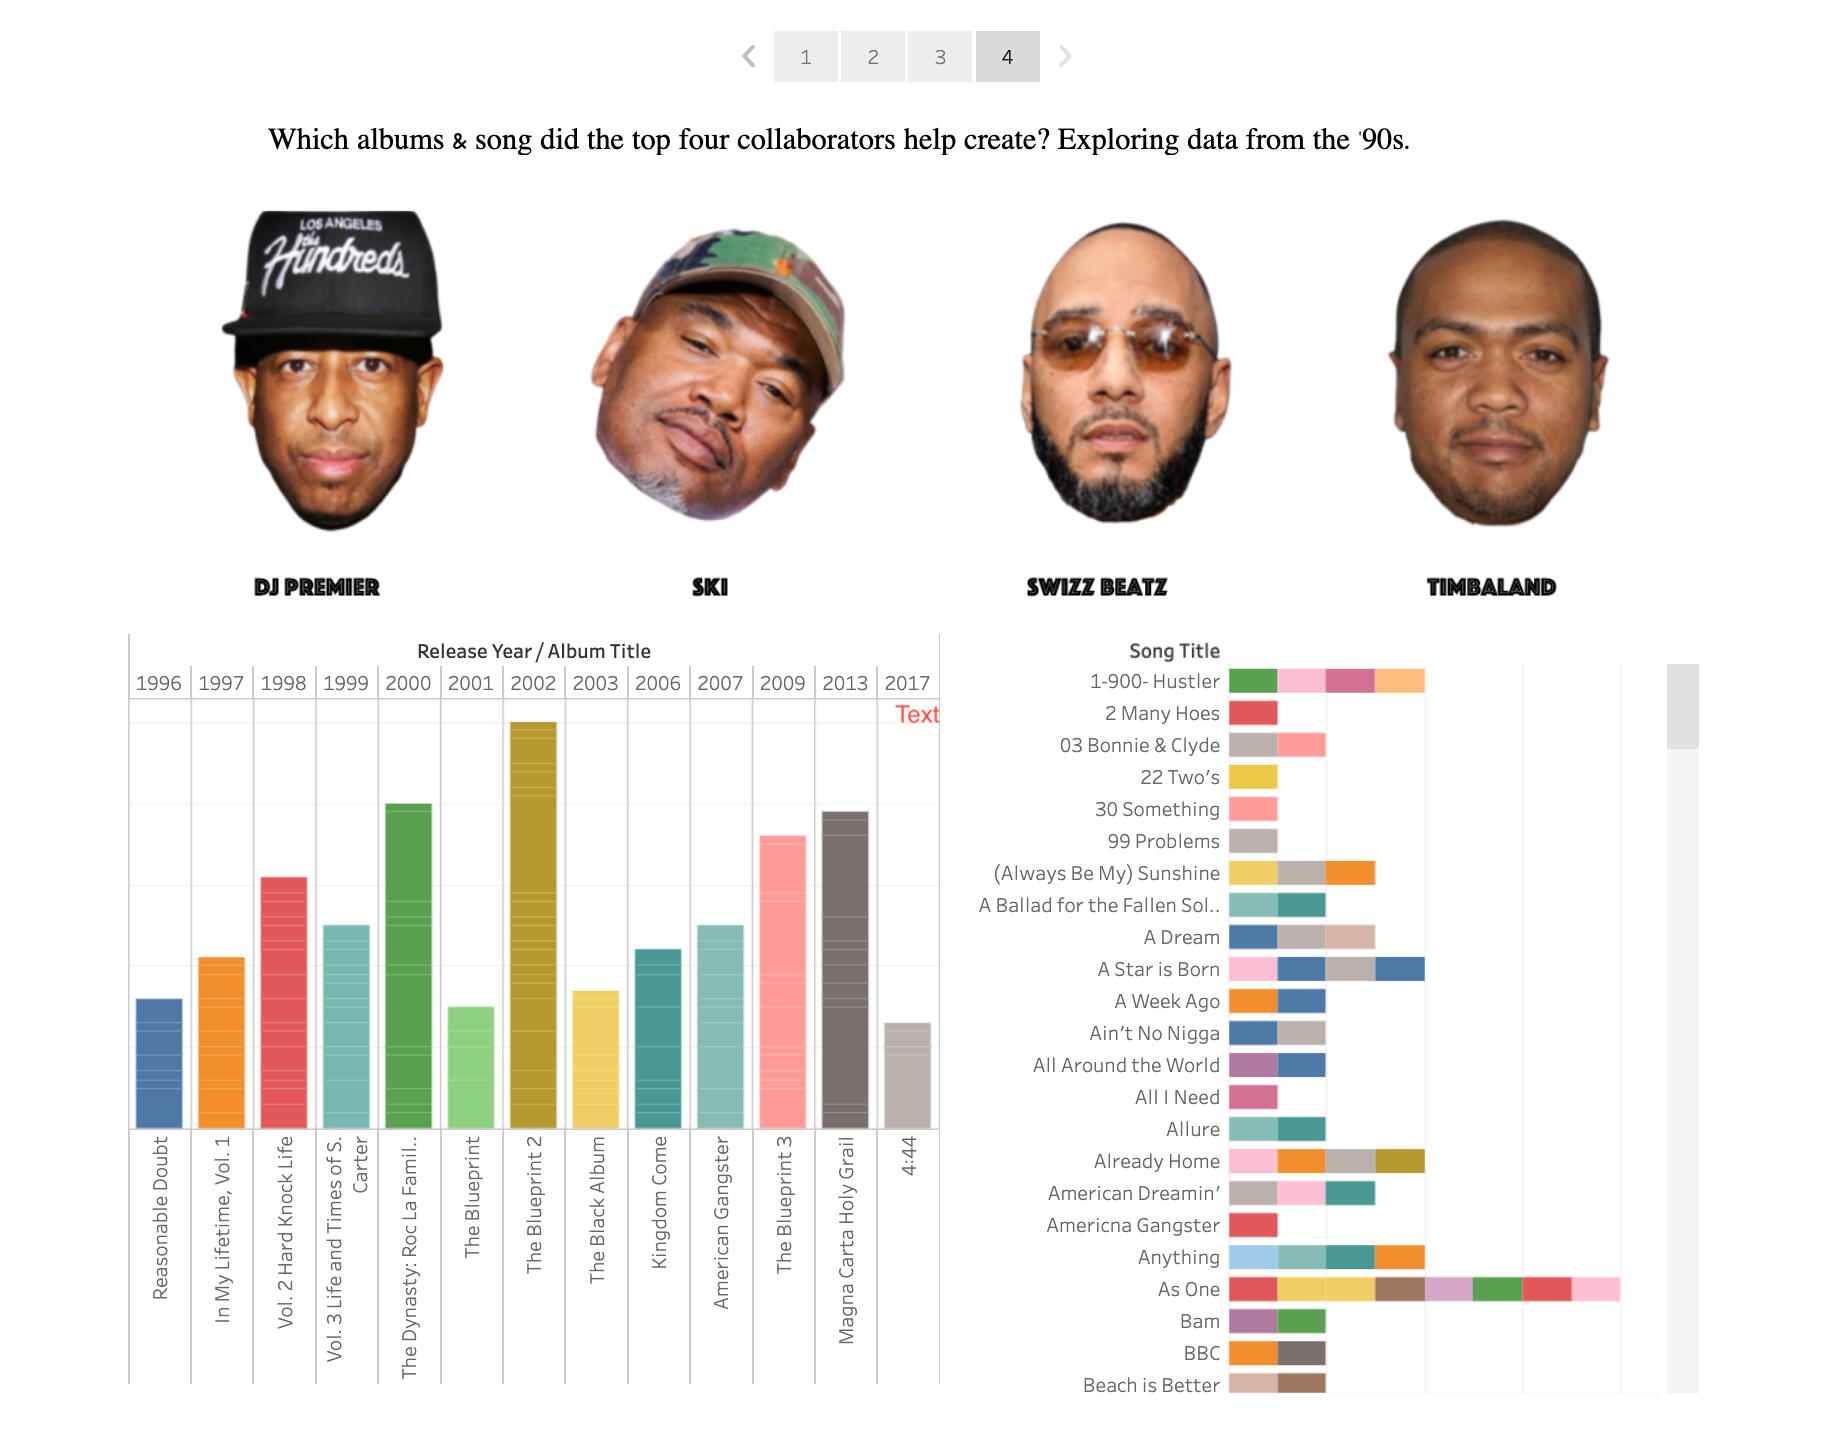
This visualization was one of many I created for my Digital Humanities course. I utilized images downloaded from the internet and edited the photos with the lasso tool and background remover software. When the workbook is on Tableau Public or Tableau Desktop, the images are clickable and act as filters with the underlying dataset.
Tableau Viz

This was one of my most recent projects and served as a visualization to highlight and juxtapose literary elements and real-life. I did not use any image editing software to create this, but I combined various open source software like Google maps, Google Earth studio, and Voyant Tools. When viewed on Tableau Public or Desktop, the map points interact with the bar chart to filter location names related to the content. This is one of my favorite pieces because I think the natural white space forms a neat grid and thus speaks more volume aesthetically versus an overcomplicated background or layout.
